
Chapter 9: Maps And Scale Introduction
Scale is the ratio between the length of two points on the map and the distance between those two points on the ground. A scale of a map can be represented in various forms. A map is a graphic representation of the features of the Earth’s surface as drawn on flat paper, according to a specific scale and on a specific map projection, using internationally accepted signs and symbols.
Any map can be 100% correct due to the representation of a three-dimensional Earth on a two-dimensional plane. Still, efforts are made to draw a map closest to its actuality on a two-dimensional plane. A small-scale map depicts a large area on paper. Wall maps, atlases, etc. are examples of small-scale maps.
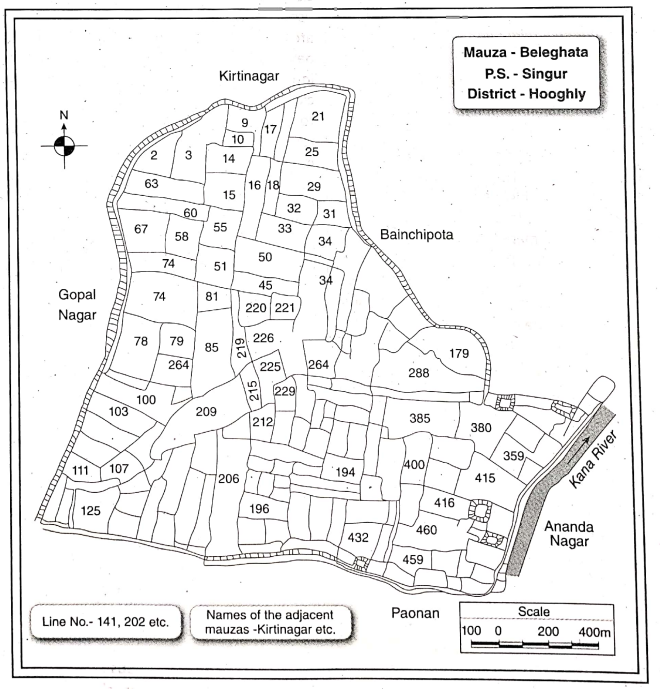
On a large-scale map, a small area is depicted on paper in a larger form. A cadastral map or matza map is an example of a large-scale map. Mauza is the lowest administrative unit in India. Its other name is census village. The scale of a cadastral map or matza map is usually 16 inches to 1 mile.
Thematic Map depicts a specific theme or subject on a map. But sometimes a thematic map depicts more than one subject. If it does so, then certainly the other subjects complement the main one. The conventional signs, symbols and use of colours in a map are explained through an index. That is why the index is called the key of a map. An index may also be labelled as a legend.
There are three types of scales that are used in a map. They are—statement scale, fractional scale and graphical scale.
Statement scale is a type of map scale expression in which the relation between the distance of two points on a map and the actual ground distance between those two points is expressed in the form of a written statement.
Representative fraction is a type of map scale expression in which, the relation between the distance of two points on a map and the actual ground distance of those two points is expressed in a ratio.
A type of map scale expression in which, the relation between the distance of two points on a map and the actual ground distance of those two points is expressed with the help of a graphical representation is known as a graphical scale. denoted by the sea, and curved lines denote the waves approaching the island.
Chapter 9 Maps And Scale Topic A Map Long Answer Type Questions
Question 1: Give a brief account of the history of the development of maps.
Answer:
History Of The Development Of Maps:-
A brief account of the history of the development of maps: When the world or a part of it is represented on a flat piece of paper drawn to a specific scale and map projection, using universally accepted conventional signs and some basic principles, it is called a map.
The history of map-making is quite old— about 4000 years. It can be discussed as follows—
According to anthropologists, the maps drawn by the Eskimos, Red Indians, and Marshall Island dwellers are quite old. Charts were made on palm leaves that were attached to narrow frames, and shells of snails or fish bones were used. Straight lines were drawn to denote the sea, and curved lines to denote the waves approaching the island.
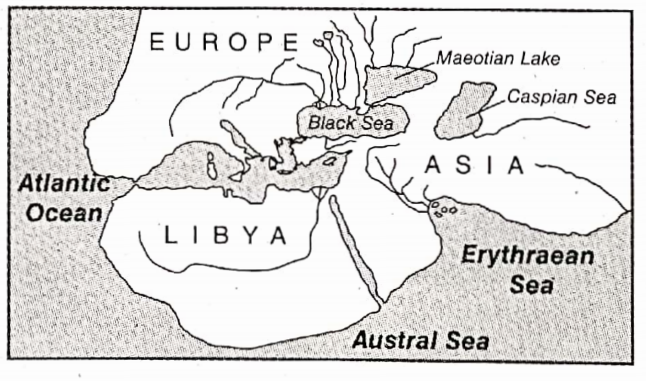
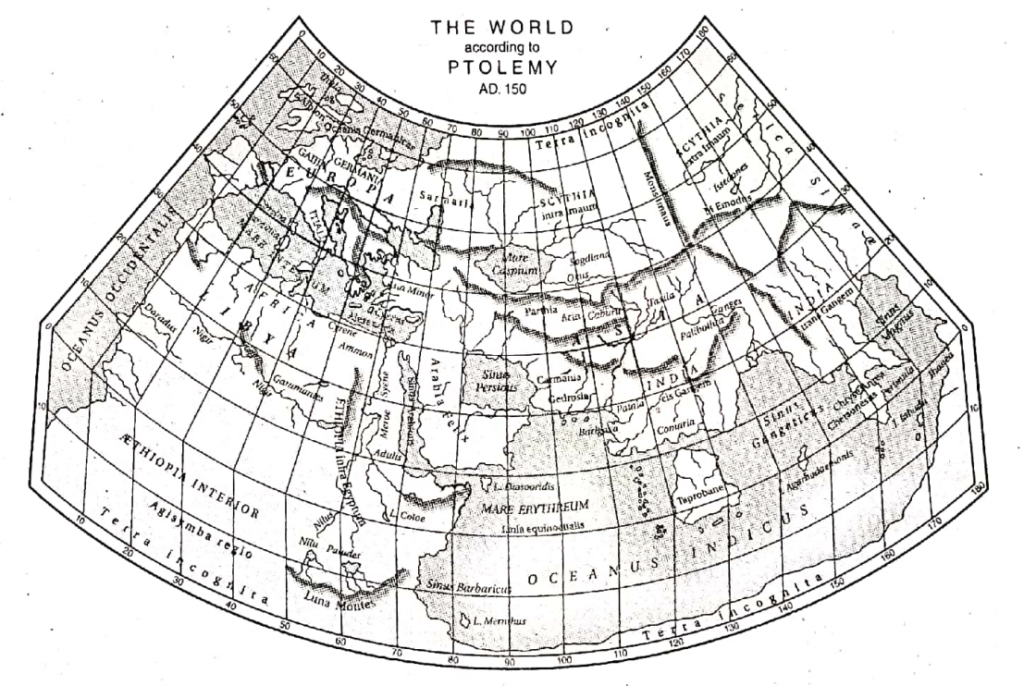
The people of Babylon were the first to divide a circle into 360 parts. The four cardinal points—north, south, east and west, were also first used by them while drawing maps. The Greeks were experts in Mathematics and Astrology. They were responsible for drawing the lines of the Equator, Tropics of Cancer and Capricorn, and North and South Poles on a spherical world. Eratosthenes was the most well-known person who could draw maps accurately. Herodotus (485 BC – 425 BC) believed that the Earth was round, comprising Asia, Europe and Libya. Ptolemy drew a map of the world as well as 26 regional maps published in his book ‘Geographia’.
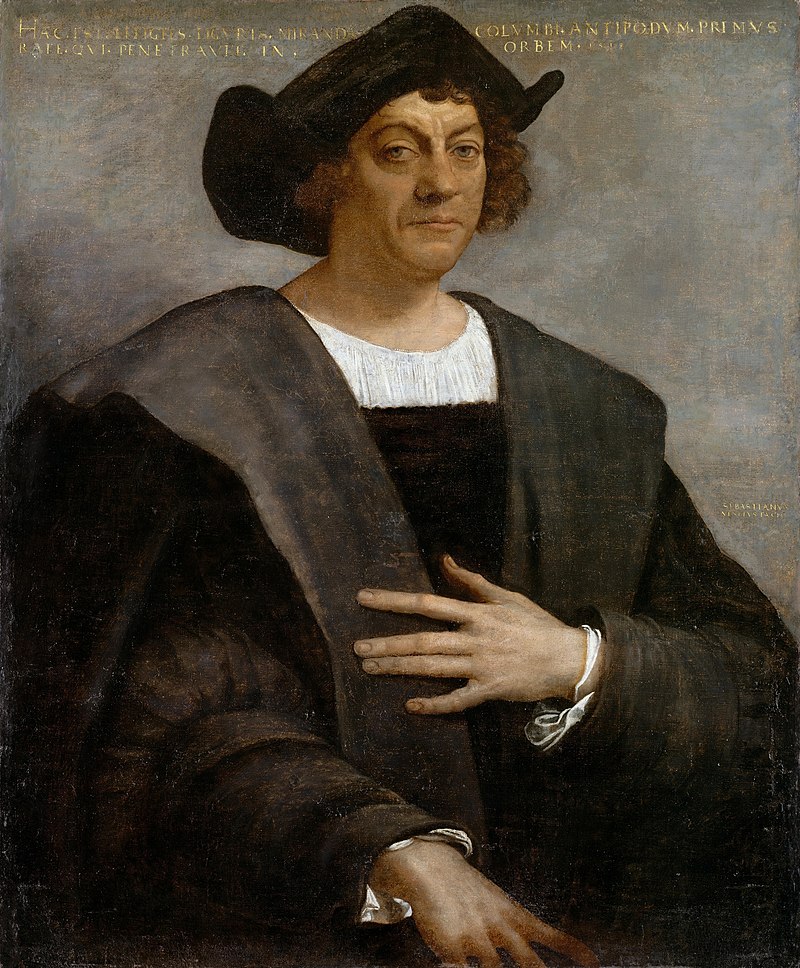
Many sailors while exploring different parts of the world, drew maps of newly discovered lands. Columbus was the most famous among them. Ramesses II, the Egyptian Pharaoh, drew a map of his empire for the convenience of tax and revenue collection. The science of map-making (cartography) was thus initiated, and it gained much importance at that time.
Question 2: What is a map? Classify the different types of maps.
Answer:
Map:
A map is a graphic representation of the features of the Earth’s surface as drawn on flat paper, according to a specific scale and on a specific map projection, using internationally accepted signs and symbols.
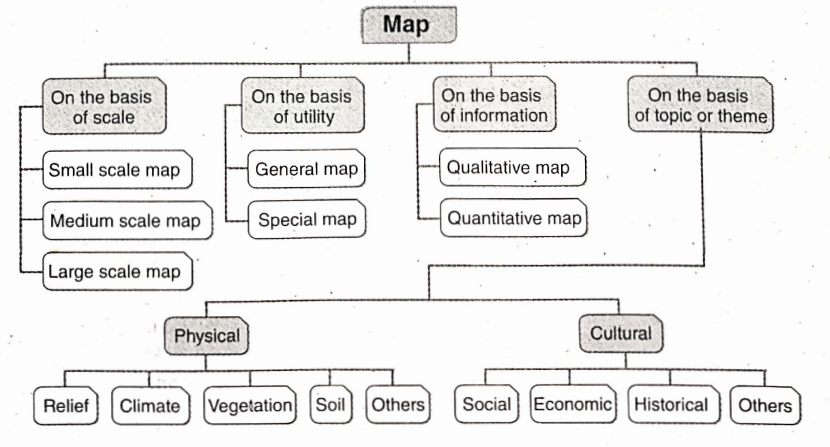
Different types of maps: There are different types of maps on the basis of different aspects.
They are —
1. Classification of maps based on the scale:
1. Small-scale maps: When a map is drawn in a small dimension on a piece of paper, representing a bigger land surface, a small scale is used. These are known as small-scale maps.’
Advantages:
(a) As the scale is small, a bigger area can be represented on a smaller dimension of space or a piece of paper.
(b)The whole world or a part of it can be represented on paper.
Disadvantages:
(a) Various symbols are used to show different components on the map, which might not be easily understandable by a layman.
(b) Due to the smaller space or dimension, details of the area cannot be shown.
Examples: Wall map, international map, navigation map, etc.
2. Medium-scale maps: When any large area is divided into smaller areas on a medium scale to be represented on paper (i.e., a map), it is called a medium-scale map. Example- topographical maps.
3. Large-scale maps: When a small area is shown on a larger scale, it is known as a large-scale map. Example—cadastral maps.
2. Classification of maps based on utility:
1. General map: When a map can be easily used or understood by the common people, it is known as a general map. Example— district map of West Bengal.
2. Special map: When a map is drawn for any specific purpose, it is known as a special map. Example—physical map of India.
3. Classification of maps based on information or data:
1. Qualitative map: This map shows the qualitative aspect of any geographical feature.
2. Quantitative map: This map shows the quantity-wise variation of geographical features, such as altitude, area, etc. Example—population density map of India, dots and sphere maps, etc.
4. Classification of maps based on topic or theme:
1. Physical map: This type of map shows the physical features of any area. Examples- relief map, climate map, etc.
2. Cultural map: When any cultural aspect is shown on a map, it is called a cultural map. Usually, the socio-economic or political aspects are depicted in such maps. Examples—social map, economic map, etc.

Question 3 Write a note on the contributions of the important cartographers.
Answer:
Note on the contributions of the important cartographers:
The Greek philosopher, Anaximander (610 B.C. B-546 BC), was the first to draw a map of a human settlement according to scale. In his map, Greece was shown in the centre of Europe and the land portion of the world was surrounded by seas on all sides.
The Greek philosopher, Eratosthenes (276 BC-194 BC), is known as the ‘Father of Geography’. He was the pioneer in using lines of latitudes and longitudes on accurately drawn maps.
Hecataeus (550 BC-476 BC) slightly modified the map drawn by Anaximander and drew it accurately with more descriptive details. This was a map showing Eurasia.
Herodotus (484 B-425 BC) is known as the ‘Father of History’. He believed that the area of land between the coastal areas of India and Spain was surrounded by seas and oceans. He divided the Earth into Asia, Europe and Libya.
Several other scholars also gave importance to drawing maps. Among them, there can be a mention of the Roman philosopher Strabo (64 BC-24 AD) and Claudius Ptolemy (90 AD- 168 AD). Ptolemy drew about 26 regional maps of different parts of the world.
In the later period, Chinese geographers and scientists drew maps on the basis of grids. Zhang Heng (78 AD-139 AD), Fi Sui (224 AD-271 AD), Chu Su Pin (1273 AD-1337 AD), etc., were well-known for drawing maps. Fi Sui is known as the ‘Father of Map Science’. This person drew the political map of China on a large scale in 276 AD.
In the middle ages, an Arabian geographer Al Idrisi (1099 AD-1161 AD) tried to draw maps as well. In the later period, Columbus, Magellan, James Cook and several other explorers made huge improvements in the methods of map-making.
In modern days, Cartography has hugely digitised with the application of Geographic Information System (GIS) techniques. But, these ancient cartographers are the ones who laid down the foundation of map-making.
Question 4 What is a thematic map? Classify thematic maps and describe each type.
Answer:
Thematic map:
A thematic map is based on the physical and cultural aspects of an area.
Classification and description of thematic maps: Thematic maps can be of two types— physical maps and cultural maps.
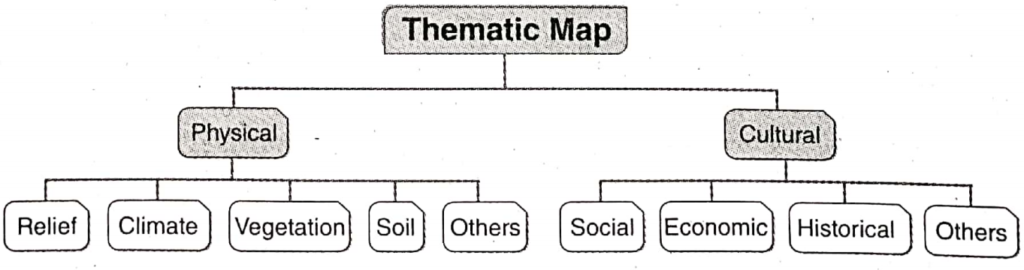
1. Physical map: This map shows the physical features, like relief, climate, and so on, of any place. Physical maps can be of various types
1. Relief map: This map helps to identify the altitude, slope, rock types, etc. E.g., the hilly, plateau and plain regions of India can easily be identified from the relief map of India.
2. Climate map: This map is based on climatic features like air pressure, rainfall, wind, cloudiness, etc. E.g., from the
rainfall map of India, we can have an idea of the areas receiving high and low rainfall.
3. Vegetation map: The types of natural vegetation os shown on such a map. E.g., from the natural vegetation map of India, evergreen, deciduous, and coniferous forests can be identified.
4. Soil map: it is drawn based on the characteristics of the soil of a region. E.g., the soil map of India reveals that the Gangetic Plain has silt, the Rajasthan region has sand, and the Deccan Plateau region has black cotton soil.
5. Others: Space-related topics such as the location of stars and planets, and also rock types, drainage basins and other such features on the Earth’s surface are shown on these maps.
2. Cultural map: The cultural aspects, like social, political, historical, economic, etc., of a particular region are shown on maps called cultural maps.
1. Social map: The maps drawn based on social aspects such as population distribution, tribal population density, linguistic data etc., are called social maps. E.g. a map is drawn of the different languages spoken in India.
2. Economic map: These maps show the distribution and characteristics of agricultural, mineral, forest, and industrial products. E.g. the mineral map of India shows how the Chota Nagpur Plateau region is rich in minerals.
3. History map: These maps show the historic places of the past, boundaries of the kingdoms and empires, etc. E.g. the expanse of the Mughal Empire shown on the historical map of India.
Question 5: What are the uses of maps? Write about its importance.
Answer:
Uses of maps:
A map is an important tool for geographers, and its importance is immense.
Its different uses are as follows—
1. It is extremely valuable for the study of history, geography, tourism, etc.
2. Precise locations (exact latitudinal and longitudinal values) can be determined from a map.
3. Large-scale maps are used if one wants to study a small part of any area intensively.
4. Maps are very important for defence personnel.
5. All changes in international and national boundaries are demarcated on maps.
6. Maps are used to show physical features and the distribution of resources.
7. Special maps (drawn on specific map projections) are used to determine the routes of planes and ships,
8. Maps are used to teach History and Geography lessons in. classrooms.
9. Maps are used to plan the development of any area and for a host of other purposes.
Importance of maps:
1. Complex topics are easily comprehended by students with the help of maps.
2. Maps are useful in giving an idea and analysing the physical and cultural features of any area.
3. Maps are important for the developmental planning of any region or local area.
4. Maps are also valuable for governance and administrative purposes.
5. Even a layman can read a map and analyse it to get a clear idea of any area as required.
Question 6: What are the subdivisions of small and large-scale maps? Why are mauza maps drawn?
Answer:
The subdivisions of small and large-scale maps:
The subdivisions of small-scale maps are —
1. Wall maps: Wall maps are drawn on a large sheet of paper showing different continents and countries.
2. Atlas or book of maps: Various maps based on different themes are drawn and published in the form of a book known as an atlas.
3. International maps: They are drawn on a 1 unit = 1 million unit scale. Besides, maps related to aviation, navigational charts, etc., are also maps of this type.
The subdivisions of the large-scale maps are
1. Blueprint: They are made to build houses, local area demarcation, plan cities, towns, etc.
2. Mauza maps: These are drawn to collect land revenue by the governmental (Land Revenue and Survey Department) agencies.
3. Topographical maps: In this type of map, different physical features, as well as cultural features, are depicted using various conventional signs and symbols. These maps play an important role in planning the development of any area (local or regional).
Reasons for drawing maze maps: Any property or land division based on surveys, any city or village with details of houses, land or plot boundaries, agricultural land, grasslands and so on are drawn on these maps. These are also called cadastral maps. In India, the Survey Department of the government publishes such maps to collect land revenue. These are large-scale maps. In India, maize maps are usually drawn on a scale of 16 inches = 1 mile.
Question 7: What is a topographical map? Note on its characteristics and importance.
Answer:
Topographical Map:
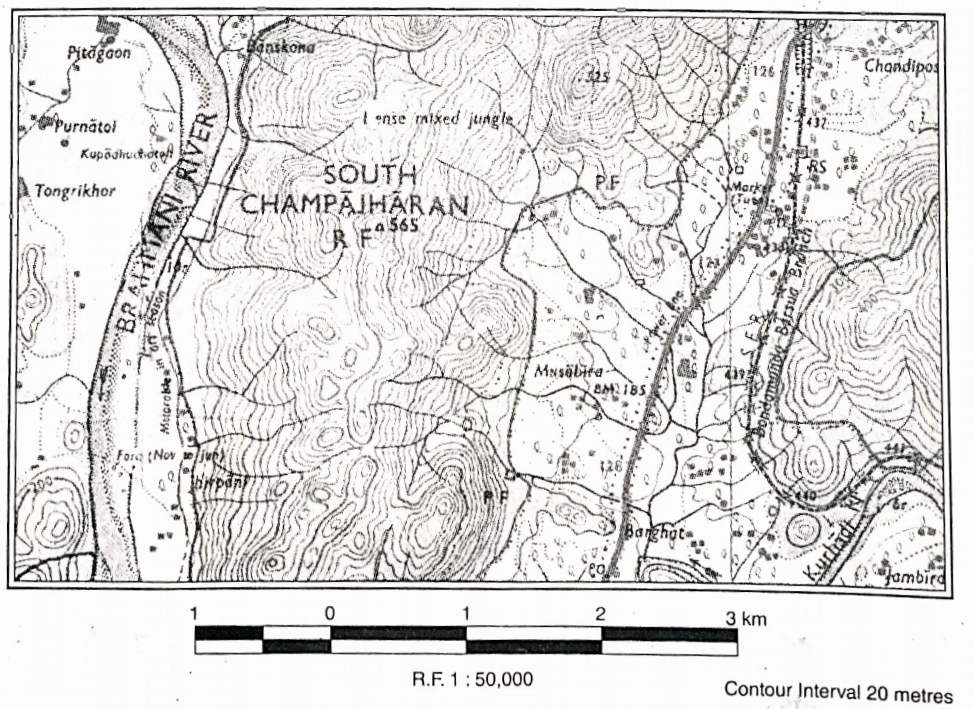
A topographical map shows the physical features and cultural composition of an area using symbols.
The word ‘topography’ originated from the Greek words ‘topos’, meaning a place and ‘graphos’, meaning to write.
Characteristics and importance: The characteristics and importance of a topographical map are as follows—
Characteristics:
The characteristic features of a topographical map are—
1. It has a fixed index number.
2. These maps have a fixed scale. E.g.— 1: 50,000.
3. The latitudes and longitudes are extended equally.
4. Specific colours and symbols are used in the maps.
5. The physical and cultural features of an area are shown here.
6. Topographical map is drawn on the basis of primary data through the survey.
Importance: Topographical maps are important for the following reasons—
1. The physical and cultural features are shown together.
2. The nature of the area can be known easily.
3. This type of map is important for the conservation of national resources. E.g. Forest resources.
4. This type of map is important for the planning of regional development.
5. This type of map is very useful for the construction of roads and railways.
Question 8 Which components are used for drawing a map? Give examples.
Answer:
Components Used For Drawing A Map:
When the world or a part of it is represented on paper as a map, the following components are of vital importance—
1. Scale: Any part of the Earth’s surface can be shown on paper in a reduced or enlarged form with the help of specific scales.
2. Map projection: The graticules (longitudes and latitudes) on which the map is drawn is known as a map projection.
3. Paper or flat surface: A paper or a flat surface on which the map is to be drawn is required.
4. Choosing a subject or theme: Specific themes, subjects or topics have to be determined before drawing a map.
5. Selecting alphabets: This has to be done for writing the heading, scale, north line, index or key, etc.
6. Indicating the north line: If the latitudes and longitudes are not shown on the map the north line has to be drawn to indicate the north direction by this sign ‘N’.
7. Drawing boundaries: Different symbols for boundaries showing the country, states, districts, coastal areas, etc., have to be chosen and marked on the map.
8. Index or Legend: An index is required as a key to the conventional signs and symbols used on a map.
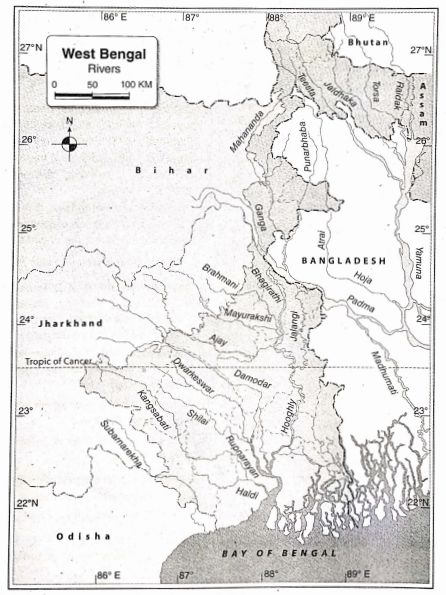
For example, in 9.12 (given on the next page) it can be observed that—
1. The scale of the map is 1 cm = 50 km (approximately).
2. On the basis of map projection the map has been drawn with a latitudinal extent of 22°N —27°N and longitudinal extent of 86°E—89°E.
3. The map is drawn on a flat surface, i.e., on paper.
4. The theme of the map is—’Rivers of West Bengal’.
5.’Rivers’ is written on the top (northwest corner) of the map.
6. N Symbo| is used in the map to indicate the north direction.
7. Different symbols which are internationally approved are used to show the boundaries of a country, states, districts and coastal areas.
Chapter 9 Map And Scales Short Explanatory Answer Type Questions
Question 1 What is the importance of a map?
Answer:
Importance Of A Map:-
A map is a drawing that is done in accordance with a particular scale and a specific projection using lines of latitude and longitude and internationally accepted colours, symbols, etc., from which many geographical data can be obtained.
The importance of a map is unparalleled. A few of them are as follows—
1. Universality: A map is used not only by a geographer but also by people from various other professions. Thus, it has a universal value.
2. Main tool of geographers: A map is the main tool of a geographer. An idea about the geographical aspects of any region of the world can be made by studying maps.
3. Administrative work: A map is necessary for several administrative purposes. For example, a cadastral map is of utmost importance in the collection of land revenue and taxes.
4. Defence purposes: Military personnel plan their routes in any region using the map of that part. Topographical maps play a major role in this respect. Besides, maps are of great use to tourists visiting unknown areas.
Question 2 What are the different types of quantitative maps?
Answer:
There are various types of quantitative maps. They are as follows—
1. Isoline maps: The maps where lines are drawn joining different places having the same values (of air pressure, rainfall, etc.) are known as isoline maps.
These maps can be of various types-
1. Isobar Maps,
2. Isotherm Maps,
3. Isohyet maps,
4. Isohaline Maps,
5. Isohel Maps,
6. contour line maps, etc.
2. Symbolic maps or maps with conventional signs: Several internationally accepted signs and symbols are used to draw these maps.
These can be of various types—
1. Dot distribution maps,
2. Circle maps, etc.
3. Geometric maps: These maps include—
1. Spherical Maps,
2. Choropleth Maps,
3. Flow Maps, etc.
Question 3 Name the tropical maps included in different series.
Answer:
The various topographical maps included in different series are—
1. International series map: These maps are drawn according to international treaties. The scale of the maps of this series is 1: 100000. Any area spanning over 4° x 4° latitudinal and longitudinal extent is covered in this map.
2. South Asian series: Iran, Afghanistan, Saudi Arabia, India, Pakistan, Sri Lanka, Bangladesh, China, Myanmar, Thailand, Vietnam, etc., are included in this series. The scale used in the series is 1: 200000. It spans over an area of 8° x 12° latitudinal and longitudinal extent.
3. Series of India and her neighbouring countries: These maps are drawn to a scale of 1: 1000000 . An area spanning over 4° x 4° latitudinal and longitudinal extent is covered in this map.
4. Map of the Survey of India department: For the ease of conducting surveys, the Survey of India department has divided the Indian subcontinent from 64° East to 100° East and 4° North to 40° North into 4° x 4° grids.
Question 4 What is a political map? Mention some of its characteristics.
Answer:
Political Map:-
A map that depicts districts, subdivisions, boundaries and important places of states and countries is known as a political map. The political map of every district depicts its subdivisions, CD Block, municipal towns, important offices, etc.
Some of the characteristics of political maps are—
1. Different administrative blocks are demarcated using lines and several symbols.
2. The bordering/neighbouring countries, states, and districts are all shown on this map.
3. An idea about the political and administrative conditions of the area depicted can be made from these maps.
Question 5 What do you mean by a globe? Discuss its importance.
Answer:
Globe:-
A globe is a small model or representation of the Earth. It is of much importance to geographers as well as people in other professions.
The importance of the globe is as follows—
1. An overall picture of the whole world can be obtained from a globe.
2. An idea about the concept of scales can be made by observing a globe.
3. An idea about the exact (locations of oceans, seas and continents can be made from a globe. © The spinning of the globe gives an idea about the rotation of the Earth.
Question 6 ‘Topographical maps are of utmost importance to geographers.’ Explain.
Answer:
A topographical map is of vital importance to geographers because—
1. Determining the relationship between physical and cultural environment: The relationship between different physical and cultural aspects of the environment can be determined through these maps, and this knowledge is valuable for geographers.
2. Nature of a region: Natural vegetation and relief (rivers, hills, plateaus, plains, etc.) of any area can be easily determined from these maps.
3. Useful in developmental planning: The construction of roads, railways, etc., together with local and regional planning, is done based on topographical maps.
Question 7 What are the advantages and disadvantages of a topographical map?
Answer:
The advantages of a topographical map are as follows—
1. Information about different natural and cultural features of the area is available from the topographical map.
2. Distance between two places on the ground can be easily calculated with the help of a topographical map scale.
3. Topographical map helps to know about the transportation (roadways, railways, etc.) and communication system (post office, telegraph line, etc.) of an area.
4. Relation between natural and cultural elements of an area can be easily identified by a topo map.
5. This map is particularly useful for defence and geographical research (with planning) purposes.
The disadvantages of topographical maps are as follows—
1. Topographical maps cannot be changed rapidly with respect to time. Therefore, sometimes huge differences can be noticed in the reality.
2. This map cannot be read without knowing the symbols and signs properly.
3. Topographical map-making is subject to time, effort and capital investment.
4. Details of each plot are not available in topographical maps.
Question 8 What are the characteristics of a maize map or cadastral map? Write the importance of this map.
Answer:
The main characteristics of cadastral maps are as follows—
1. Cadastral map is a type of large-scale map. It contains a detailed description of the land.
2. The scale of a cadastral map is usually 16 inches to 1 mile.
3. It contains all types of village and urban land use.
4. In this map, the detail of each land is recorded according to its J.L. NO. or Jurisdiction List Number.
The importance of cadastral maps is as follows—
1. A cadastral map contains the description of houses and plots of urban and village areas, by which regional development can be managed well.
2. The role of the cadastral map is utmost to determine the land uses and collection of land revenue.
Question 9 Differentiate between a glode and a map.
Answer:
The differences between a globe and a map are as follows—
| Point of difference | Globe | Map |
| 1. Nature | It is a three-dimensional representation of the world | It is a two-dimensional representation of the world |
| 2. Determination of distance | Determining the distance between two points is difficult on a globe. | Determination of the distance between two points is relatively easy on a map. |
| 3. Uses | It is less useful than a map. | It is more useful than a globe. |
Question 10 What are the differences between a small-scale map and a large-scale map?
Answer:
The differences between a small-scale and a large-scale map are as follows—
| Point of difference | Small scale map | Large scale map |
| 1. Concept | A large area is depicted in a smaller form on paper in this type of map. | A small area is depicted in a larger form on paper In this type of map. |
| 2. Scale | The ratio of the scale is small, for example, 1:1000000. | The ratio of the scale is large, for example, 1:4000. |
| 3. Data obtained | Loss details are shown in this type of map, for example, a wall map. | More details are shown in this type of map, for example, a cadastral map. |
Question 11 What are the differences between a qualitative map and a quantitative map?
Answer:
The differences between a qualitative and a quantitative map are as follows—
| Point of difference | Qualitative map | Quantitative map |
| 1. Concept | Qualitative aspects of various geographical factors arc expressed in these maps. E.g.—Landuse map. | Quantitative aspects of various geographical factors are expressed in these maps. E.g —Isotherm map. |
| 2. Measurement | Geographical components cannot be measured in these maps. | Geographical components can be measured properly in these maps. |
| 3. Statistical use | These maps are not useful for statistical purposes. | These maps are of much use for statistical purposes. |
Question 12 Write the differences between a physical map and a cultural map.
Answer:
The differences between a physical map and a cultural map
| Point of difference | Physical map | Cultural map |
| 1. Concept | This type of map shows the physical features of a geographical region. | This type of map shows the cultural aspects of a particular region. |
| 2. Components/ Features | Separate maps are drawn depicting each physical feature in this case. | Different components or features are depicted together in these maps. |
| 3. Example | Tectonic map, a relief map, weather map. vegetation map, etc. | Social, political, regional, land use maps, etc. |
Question 13 Differentiate between the topographical map and the cadastral map.
Answer:
The differences between a topographical map and a cadastral map are as follows—
| Point of difference | Topographical map | Cadastral map |
| 1. Concept | The distribution of physical and cultural aspects of a region is shown in this type of map. | Data related to land use is represented in this type of map. |
| 2. Scale | These maps are drawn on medium or small scales. | These maps are drawn only on a large scale. |
| 3. Composition | Physical and cultural aspects are shown using internationally accepted symbols in these maps. | Lakes, fields, schools, etc., are shown on these maps. |
| 4. Uses | These maps are used in surveys of resources and defence purposes. | These maps are used for the collection of land revenue and taxes. |
Chapter 9 Map And Scales Short Answer Type Questions
Question 1 What is a map?
Answer:
Map:-
A map is a graphic representation of the features on the Earth’s surface. It is drawn on flat paper using a specific scale, and with internationally accepted signs and symbols.
Question 2 How were maps made in ancient times?
Answer:
Maps Made In Ancient Times As Follows:-
The maps drawn by the Eskimos, Red Indians and the inhabitants of Marshall Island are considered to be the most ancient by archaeologists. They made maps by tying the scales of fishes and shells of molluscs to slender structures using palm leaves.
Question 3 Who first used the sense of direction while drawing a map?
Answer:
The Babylonians first used the sense of directions—east, west, north and south while drawing a map.
Question 4 Based on the scale, how many types of maps are there and what are they?
Answer:
Types Of Maps:-
On the basis of scale, maps are of three ‘ types— small-scale maps, medium-scale maps and large-scale maps.
Question 5. What are the advantages of a small-scale map?
Answer:
The advantages of a small-scale map are as follows—
1. In small-scale maps, the area shown is larger.
2. The whole world, or parts of it, can be shown on a single piece of paper.
Question 6 What are the advantages of a large-scale map?
Answer:
The advantages of a large-scale map are as follows—
1. A small area can be shown in greater detail.
2. Different features can be marked on the map using internationally accepted symbols.
Question 7 What are the main components used for drawings maps?
Answer:
Main Components Used For Drawings Maps:-
The main components used for drawing a map are scale, projection, a plane surface, subject or theme, a north arrow, and drawing of boundary lines.
Question 8 What is a blueprint?
Answer:
Blueprint:-
The plan of construction of a house, market, town, etc., drawn beforehand using a specific scale, is called a blueprint. The scales of a blueprint are usually 1:500, 1: 1250,1 inch to 8 feet, etc.
Question 9 What type of map is a topographical map?
Answer:
A topographical map is a medium or small-scale map. The scale ranges between 1: 50000 and 1: 10000000.
Question 10 What is a cadastral map?
Answer:
Cadastral Map:-
A map that shows the shape of plots of land, the areas and boundaries along with specific ‘dag’ numbers in a village, drawn to a particular scale, is known as a cadastral map. The scale of a cadastral map is usually 16 inches to 1 mile. These maps are used for the collection of land revenue and taxes.
Question 11 What is the use of a cadastral map?
Answer:
Use Of A Cadastral Map:-
Cadastral maps are used by land revenue offices for the collection of land revenue. These maps are also used for drawing land use maps.
Question 12 Based on purpose and utility, maps can be divided into how many types?
Answer:
Maps can be of two types— general map (e.g., map of India and its neighbouring countries) and special map (e.g., map of roadways of an area).
Question 13 What is a quantitative map?’
Answer:
Quantitative Map:-
A quantitative map is a map that gives a statistical representation or quantitative aspect of the various elements in a geographical region. For example, population density map of India.
Question 14 What is a thematic map?
Answer:
Thematic Map:-
A map that represents any natural or cultural component of a region is known as a thematic map. At times, more than one component may also be depicted on such maps, where there is one primary subject and others are auxiliary subjects. For example, weather map.
Question 15 What is a physical map?
Answer:
Physical Map:-
A map that shows physical features, such as relief, rivers, etc., of an area, is known as a physical map.
Question 16 What is a cultural map?
Answer:
Cultural Map:-
A map that represents cultural features, such as religion, language, distribution of population, etc., of an area is known as a cultural map.
Question 17 What is a reduced map?
Answer:
Reduced Map:-
When a map is depicted in a smaller form, it is known as a reduced map and the process is known as reduction. In this case, the scale of the map gets enlarged.
Question 18 What is an enlarged map?
Answer:
Enlarged Map:-
When a map is depicted in a larger form, it is known as an enlarged map and the process is known as enlargement. In this case, the scale of the map gets reduced.
Question 19 Which kind of maps are used for making atlases?
Answer:
Kinds Of Maps Are Used For Making Atlases Are Given Below:-
Small-scale maps are used for making atlases or the globe. Details of a particular region cannot be shown accurately in these maps.
Question 20 What is a weather map?
Answer:
Weather Map:-
A weather map shows the components of the weather of a particular place, such as temperature, humidity, rainfall, air pressure, cloudiness, etc. Weather forecasts can be made based on these maps.
Question 21 What do you understand by a political map?
Answer:
Political Map:-
A political map shows the location of a country, its boundaries, states, capitals, location of administrative centres, etc. The political and administrative structure of any country or region can be observed from such a map.
Question 22 What is a relief map?
Answer:
Relief Map:-
A map that depicts the altitude or depth of different regions on the Earth’s surface, and gives a representation of hills, mountains, plateaus and plains, is known as a relief map. Contour lines are generally used to depict the relief features on these maps.
Question 23 What is the importance of symbols in a map?
Answer:
Importance Of Symbols In A Map:-
All the features of a particular geographical region cannot be shown on a map. Hence, only the necessary features (according to the purpose of the map) are shown on it with the help of symbols. These symbols are accepted universally.
Question 24 Why can’t detailed data cannot be shown on small-scale maps?
Answer:
Many details cannot be shown on small-scale maps because—
1. Use of symbols: Since a large area is depicted in a small space, it is not possible to mark each feature with a symbol. Hence small scale maps cannot depict all features, in detail.
2. Complicated topics: Physical, cultural, and economic features (thematic maps) cannot be shown on a small-scale map, and therefore the interpretation of these complicated themes is not possible.
Chapter 9 Map And Scale Multiple Choice Type Questions [Mcq Type]
Write the correct answer from the given alternatives
1. The concept of a rectangular Earth was proposed by—
1. Eratosthenes
2. Herodotus
3. Hecataeus
4. Ptolemy
Answer: 2. Herodotus
2. The number of regional maps shown in Ptolemy’s ‘Geographia’ are—
1. 20
2. 22
3. 26
4. 24
Answer: 3. 26
3. On the basis of scale, maps can be classified into—
1. 3 types
2. 4 types
3. 5 types
4. 6 types
Answer: 1. 3 types
4. Representative Fraction (R.F.) of maps in an atlas is—
1. 1: 10000
2. 1: 200000
3. 1: 1000000
4. 1: 50000
Answer: 3. 1 : 1000000
5. The R.F. of a cadastral map is—
1. 1 : 3960
2. 1 : 10000
3. 1 : 1000
4. 1: 100000
Answer: 1. 1: 3960
6. A magnetic compass always points to the—
1. North
2. South
3. East
4. West
Answer: 1. North
7. The word ‘map’ has been derived from the Latin word—
1. Mapia
2. Mappa
3. Mappo
1. Mapin
Answer: 2. Mappa
8. Mappa means—
1. A Piece Of Paper
2. A Part Of The World
3. A Piece Of Cloth
4. A Piece of land
Answer: 3. A Piece Of Cloth
9. A map is a type of—
1. Photograph
2. Sketch
3. Coloured Image
4. Symbol
Answer: 2. Sketch
10. A topic or theme-based map is a —
1. Thematic Map
2. Qualitative Map
3. Wall Map
4. Natural vegetation map
Answer: 1. Thematic Map
11. A political map is an example of—
1. Scale-Oriented Map
2. Information-Oriented Map
3. Topic/Theme Based Map
4. Quantitative Map
Answer: 3. Topic/Theme Based Map
12. The most useful map for geographers is the—
1. Topographical Map
2. Cadastral Map
3. Political Map
4. Geotectonic Map
Answer: 1. Topographical Map
13. The map used for collecting land revenue is called a—
1. Political Map
2. Map Of the Police Station
3. Geotectonic Map
4. Cadastral Map Or ‘Mauza’ Map
Answer: 4. Cadastral Map Or ‘Mauza’ Map
14. One of the features of a weather map is—
1. Cultivated Land
2. Minerals Found Underground
3. Altitude Of Land
4. Cloudiness
Answer: 4. Cloudiness
15. An example of a small-scale map is—
1. Topographical Map
2. Cadastral Map
3. Globe
4. Weather Map
Answer: 4. Weather Map
16. The signs and symbols used in maps are accepted.
1. Locally
2. State-Wide
3. Nationally
4. Internationally
Answer: 4. Internationally
17. The headquarters of the Survey of India is in—
1. Mumbai
2. Pune
3. Dehradun
4. Delhi
Answer: 3. Dehradun
18. The globe is drawn on a—
1. Small Scale
2. Large Scale
3. Medium Scale
4. None Of These
Answer: 1. Small Scale
19. The headquarters of NATMO is in—
1. Delhi
2. Kolkata
3. Dehradun
4. Ranchi
Answer: 2. Kolkata
20. The first book of maps was published by—
1. Mercator
2. Aryabhatta
3. Hecataeus
4. Herodotus
Answer: 1. Mercator
21. ‘Mauza’ map is a type of
1. Cadastral Map
2. Topographical Map
3. Atlas
4. None Of These
Answer: 1. Cadastral Map
22. The J.L. number is given in—
1. Topographical Map
2. Cadastral Map
3. Atlas
4. None Of These
Answer: 2. Cadastral Map
23. The smallest administrative unit of revenue collection is called a —
1. Village
2. Town
3. Block
4. Mauza
Answer: 4. Mauza
24. In which of these maps land ownership is marked?
1. Topographical Map
2. Cadastral Map
3. Political Map
4. Atlas
Answer: 2. Cadastral Map
Chapter 9 Maps And Scale Fill In The Blanks With Suitable Words
1. A Physical map shows the relief.
2.’Mauza map is a large-scale map.
3. The mountains are represented by the colour Brown on a map.
4. A political map shows the location of a country or state.
5. A wall map is an example of a small-scale map.
6. The diametrically opposite direction of the southeast is north-west
7. Weather map is a type of thematic map that shows the relief scale map.
8. The word ‘map’ has been derived from the Latin word mappa
9. The side of any location can be determined from the direction of sunrise observed at that place.
10. A map is an important component of geography
11. The distribution of crops in India is an example of a map of economic
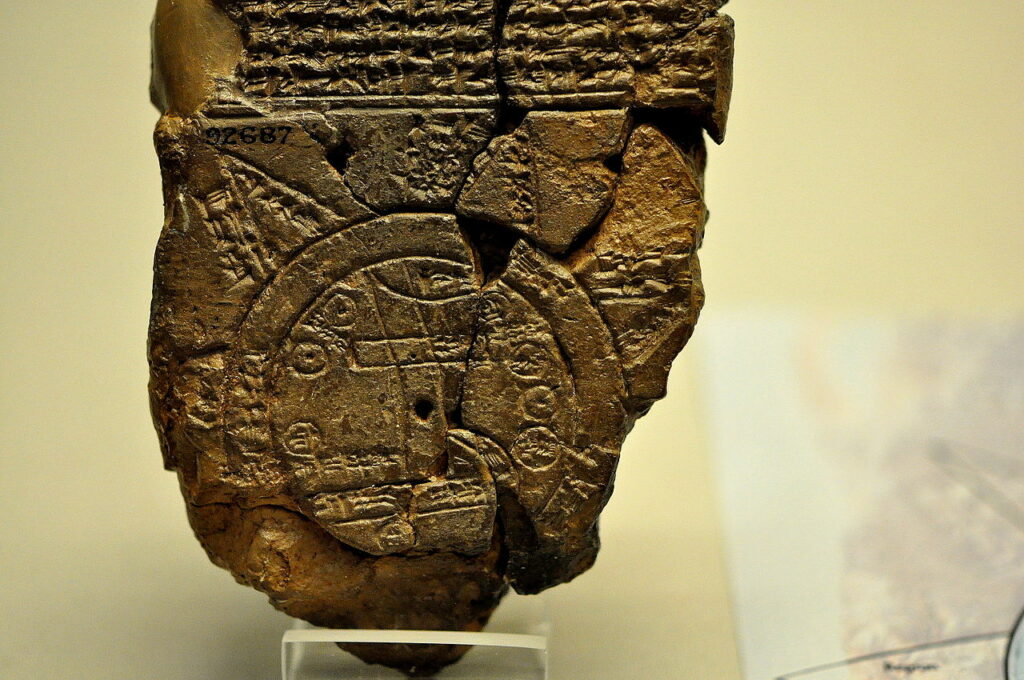
12. The oldest map of the world was drawn on mudstone
13. Map is a type of sketch
14. The symbols used in maps are internationally accepted.
15. An international map is a type of map small scale
16. A map indicating isohyet is a quantitative map.
17. The Survey of India publishes the topographical map of India.
18. In a topographical map, the three main natural aspects are rivers relief, natural vegetation and
19. The main cultural aspects of a topographical map are transport, communication and set elements
20. The ‘dag’ numbers of individual plots are marked cadastral on a map.
21. The scale drawn for a village cadastral map is 16 inches to 1mile
22. The map shows the boundary political and capital of a country.
23. The rock types of any area can be shown on a geographical map.
24. A weather map is used for obtaining information on rainfall and temperature.
25. A map is vital topographical for defence purposes.
26. A scale is drawn to show the between the map distance ratio and the actual ground distance.
27. Based on general characteristics, maps can be divided three into types.
28. A political map is a type of thematic map.
29. In a topographical map, the contour lines are shown in colour Brown
30. They are shown Forests in green on a map.
31. A map shows telephone Topographical lines.
32. A topographical map shows the relationship between cultural physical and features.
33. cadastral maps are used for collecting revenues and taxes.
34. Maps which are depicted in a small form are called reduced maps.
35. A globe is smaller than a model of the Earth.
Chapter 9 Maps And Scale If The Statement Is True, Write T And If False, Write False Against The Following
1. A globe is a small model of the Earth. True
2. The ‘N’ indicates north on the map. True
3. White colour is used to indicate water on a map. False
4. Projection is important in drawing maps. True
5. It is possible to show the spherical shape of the Earth on a map. False
6. Internationally accepted symbols are used in maps. True
7. A map is a diagram where lines have been drawn arbitrarily. False
8. Maps only depict mountains, rivers, hills, towns and ports. False
9. An economic map is a thematic map. False
10. An isohyet map is an informative or thematic map. True
11. Railways, bridges, and ferries are shown on a geological map. False
12. Spotheights and benchmarks are shown on cadastral maps. False
13. A political map is most useful when a small part of a village or town has to be identified. False
14. Opposite direction of the southwest is the northwest. False
15. Locally accepted symbols are used in the maps. False
16. Lowest administrative unit in India is a village. False
Chapter 9 Maps And Scale Match The Left Column With The Right Column
1.
| Left Column | Right Column |
| 1. Hill, mountain | A.soil map |
| 2. Types of soil | B. weather map |
| 3. Nature of weather | C. Relief map |
| 4. state division | D. political map |
Answer: 1-C,2-A,3-B,4-D
2.
| Left Column | Right Column |
| 1. Forest | A. Blue |
| 2. waterway | B. Yellow |
| 3. Agricultural land | C. Green |
| 4. Roadways | D. Red |
Answer: 1-C,2-A,3-B,4-D
Chapter 9 Maps And Scale Answer In One Or Two Words
Question 1 Where was the oldest map found?
Answer: Babylon.
Question 2 How is the distance between two places determined from a map?
Answer: Using a scale.
Question 3 Who had first determined the circumference of the Earth?
Answer: Eratosthenes.
Question 4 What is the meaning of ‘cartography’?
Answer: The art of drawing maps.
Question 5 Give an example of a large-scale map.
Answer: Cadastral map or’mauza’map.
Question 6 Who was the first geographer to publish an atlas in the 16th century?
Answer: Mercator.
Question 7 Which instrument indicates the magnetic directions of the Earth?
Answer: Magnetic compass.
Question 8 Name the colour used for showing agricultural fields on a map.
Answer: Yellow.
Question 9 Which colour on a map indicates forests?
Answer: Green.
Question 10 The first book of maps was named after which Greek God?
Answer: Atlas.
Question 11 What is a village formally called?
Answer: ‘Mauza’.
Question 12 A map is known by which other name?
Answer: Sketch.
Question 13 What are the central themes of a map?
Answer: Various physical and cultural aspects.
Question 14 How many types of maps are there, based on the type of drawing?
Answer: 3 types.
Question 15 What type of map is a wall map?
Answer: Small-scale map.
Question 16 What type of map is an economic map?
Answer: Cultural.
Question 17 Which type of map is drawn by drawing contours?
Answer: Topographical map.
Question 18 Which map shows agricultural land?
Answer: Land use map.
Question 19 What is the name of the map drawn according to a plan and used for construction work?
Answer: Blueprint.
Question 20 What is the meaning of the symbol map?
Answer: North direction.
Question 21 Which type of map shows hills, mountains, rivers, etc.?
Answer: Physical map.
Question 22 Which type of map shows the location of a country or state?
Answer: Political map.
Question 23 What are those maps called which depict physical and cultural features?
Answer: Thematic maps.
Question 24 Which type of, the map shows the characteristics of soil?
Answer: Soil map.
Question 25 Give an example of a quantitative map.
Answer: Population density map of India.
Question 26 Give an example of a medium-scale map.
Answer: Topographical map.
Question 27 By which colour are roads and settlements shown in a topographical map?
Answer: Red.
Question 28 What is the book containing different types of maps called?
Answer: Atlas.
Question 29 Which organisation publishes topograph physical maps of India?
Answer: Survey of India.
Question 30 How many types can maps be classified into, based on data, theme or information?
Answer: Two types.
Question 31 Name the type of map which depicts the quantity of any geographical feature.
Answer: Quantitative map.
Question 32 Which kind of maps are used to draw an atlas or a globe?
Answer: Small-scale maps.
Question 33 Name the person who first gave the idea of a rectangular Earth.
Answer: Herodotus.
Question 34 What is the full form of NATO?
Answer: National Atlas and Thematic Mapping Organisation.
Chapter 9 Map And Scale Topic B Scale Long Answer Type Questions
Question What is map scale? Classify map scales.
Answer:
Map scale:
The ratio of the distance between two points on a map and the actual ground distance between those two points is called map scale. For example, if the distance measured on the map is1 cm and that on the ground is 5 km,
the map scale will be1 cm = 5 km.
Classification of the map scale: There are various types of scales that are used in maps. They are
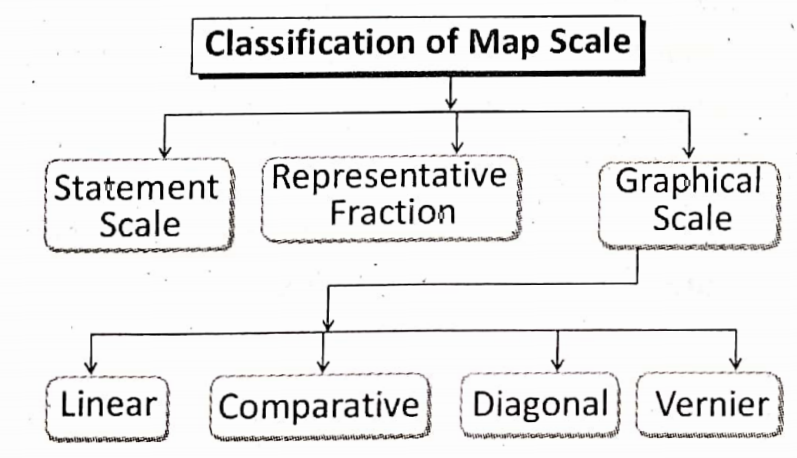
Statement scale: When the distance between two points on a map and the corresponding distance between these two points on the actual ground is expressed in a descriptive manner, i.e., in a statement form, it is called a statement scale. For
example,1 cm = 2 km. This means that a 1 cm distance on the map represents a 2 km distance on the ground.
2. Representative fraction scale: When the map distance and actual ground distance are expressed as a ratio, it is called a representative fraction. E.g., if on a map the scale is mentioned as 1:4000, it implies that 1 unit distance on the map is equivalent to 4000 units distance on the actual ground.
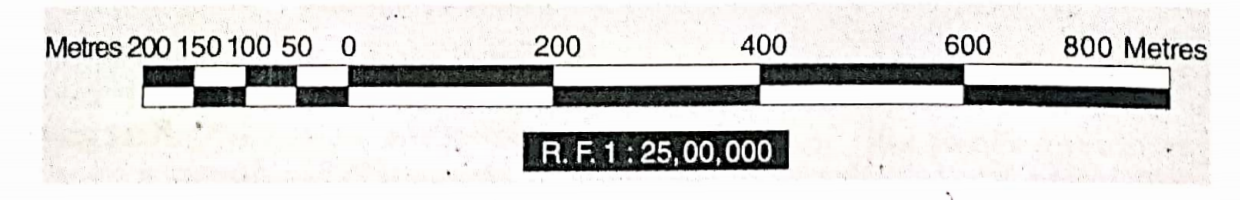
3. Graphical scale or drawn scale: When the distance on the map and the corresponding distance on the actual ground is shown with the help of a graphical representation, it is called a graphical scale. Graphical scales can be further divided into four types—
1. Linear scale: When the map distance and ground distance is represented by drawing a straight line with measurements on it, it is called a linear scale.
2. Comparative scale: when two different units are represented at the same time with different measurements indicated on either side points on the actual ground is expressed in a descriptive manner, i.e., in a statement scale.
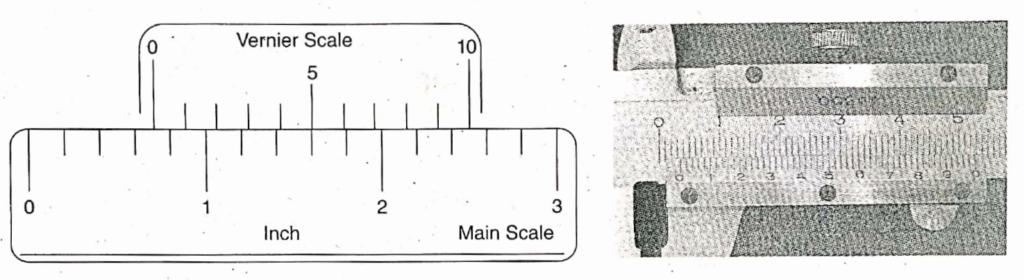
3. Vernier scale: In this scale, a small scale slides along a main scale, indicating the actual measurement that lies between two marks on the main scale. This scale can measure very small areas.
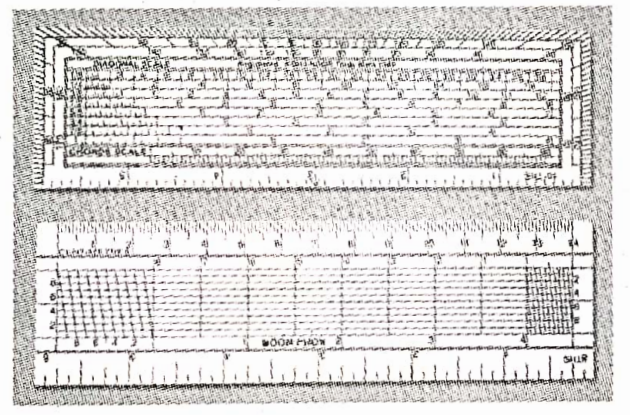
4. Diagonal scale: When the primary divisions of a linear scale are converted into further subdivisions for accurate measurements, the scale used is called a diagonal scale.
Question 2 What are the uses and importance of scale in maps?
Answer:
Uses of scale in maps:
The different uses of scale in maps are as follows—
The actual size of any area on a map can easily be determined with the help of a scale.
1. Use of scale is mandatory for drawing an accurate map.
2. Any map can be reduced or enlarged accurately with the help of scale.
3. The distance between any two points can be measured on a map with the help of scale in order to determine the actual distance on the ground.
4. Land can be measured accurately using a vernier scale.
Importance of scale:
The importance of scale in maps is as follows—
1. A map cannot be drawn and is incomplete without a scale.
5. Scale is important for determining the length, width, etc., of any region.
1. Scale is valuable in determining the cost of building or contracting anything by a planner or a designer.
2. Vernier scale is important for taking minute measurements.
Chapter 9 Map And Scale Short Explanatory Answer Type Questions
Question 1 What are the uses of the scale on a map?
Answer:
The uses of the scale of a map are—
The area of land shown on the map can easily be determined with the help of scale.
1. Usage of scale is necessary to draw the map perfectly.
2. A map can be reduced or enlarged with a change of scale.
3. The actual distance between two places on the ground can be determined by measuring the distance between those two places on the map with the help of scale.
Question 2 What is the importance of the scale of a map?
Answer:
The importance of the scale of a map is—
1. It is not possible to draw a map without a scale.
2. A scale is important to determine the length, width and height of any place.
3. Scale is very important to the planners or designers when they draw designs) because they can cite an estimation of their project costs.
4. Vernier scale is important for taking fractional measurements.
Question 3 ‘Scales are of utmost importance in maps.’ Why?
Answer:
A scale is important in a map due to.the following reasons—
1. Measurement: A map can be reduced or enlarged using a scale. Distance between two points, the area of a region, can also be calculated using a scale.
2. Representation of the Earth: The three-dimensional world can easily be represented on a two-dimensional surface (paper) with the help of a scale.
3. Other uses: Scales are vital in geographical research, surveys, defence purposes, etc.
Question 4 What are the advantages and disadvantages of a statement scale?
Answer:
A statement scale has various advantages and disadvantages.
Advantages: Some of its advantages are—
1. It is a simple scale, and can be used easily for interpreting maps.
2. As it is written in the form of a statement, there is no need for drawing.
3. Complex mathematical calculations are not required in this scale.
Disadvantages: Some of the disadvantages of a statement scale are—
1. Only the person who knows the language in which the scale is written will be able to comprehend it.
2. Changing the units of measurement is difficult in this system and is a time-consuming process.
3. If the map is enlarged or reduced, the scale has to be calculated again.
Question 5 mentions the advantages and disadvantages of a linear scale.
Answer:
A linear scale has its own set of advantages and disadvantages.
Advantages: Some of its advantages are
1. This scale is very easy to understand as the calculations are not complex.
2. In case of enlargement or reduction of the map, the linear scale gets reduced or enlarged proportionately. Thus, the map distance and the ground distance remain the same.
3. The area of a map can be easily determined with the help of this scale. A short distance on a map can also be measured accurately with the help of this scale.
Disadvantages: Some of its disadvantages are—
1. Calculations required for drawing this scale are very complex.
2. Designing the scale along with headings to make it presentable is a laborious and time-consuming process.
Question 6 How is the R.F. determined from a statement scale?
Answer:
Determination Of R.F. From A Statement Scale:-
When a scale of a map is expressed as a statement, it is known as a statement scale. This is the easiest way of writing a scale. A statement scale can be converted into R.F. scale in two ways.
1. Determination of R.F. by the formula: R.F= Map Distance/ Ground Distance
For example, if 16 inches on the map is equal to 1 mile on the ground, then
16 inches/ 63360 inches [1 mile= 63360 inches]
1/3960
Therefore, the R.F. of the map = 1: 3960
2. Determination of R.F. by the unitary method:
If a distance of 10 km on the ground is represented by l.cm on the map, the R.F. of that map will be,
1 cm on the map = 10 km on the ground or,
1 cm on map = 10 x 100000 cm = 1000000 cm
Therefore, the R.F. of the map = 1: 1000000.
Question 7 How can the statement scale be determined from the R.F.?
Answer:
Determination Of Statement Scale From R.F:-
The statement scale can be both R.F. in the given method— If the R.F. of a map is 1: 500000, the statement scale will be—
Distance of 1 cm on the map = 500000 cm on the ground or, 12.6 cm on the map = 31.5 x 100000 cm on the ground
Therefore, 1 cm on the map = 31-5 x 100000 = 250000 cm on the ground 12.6
Hence, the R.F. of the topographical map = 1: 250000.
or,.l cm on the map = =5 km on the , 100000 ground.
Therefore, the statement scale is 1 cm to 5 km.
Question 8 A railway line has been measured to be 12.6 cm in length on a topographical map. The actual length of that railway line is 31.5 km. What is the R.F. of the map?
Answer:
A distance of 12.6 cm on the topographical map = 31.5 km on the ground or, 12.6 cm on the map = 31.5 x 100000 cm on the ground folk
Question 9 What are the differences between a statement scale and a graphical scale?
Answer:
The differences between a statement scale and a graphical scale are as follows—
Differentiate between a fractional scale (representative fraction) and a graphical scale.
| Point of difference | Statement scale | Graphical scale |
| 1. Nature | It is written in the form of a statement, for example, 1 cm to 5 km. | This scale has a graphical representation. |
| 2. Types | It can be of no other type. | It can be of 4 types-linear. comparative, diagonal, and vernier. |
| 3. Uses | It is easy to use but is used less frequently. | Using this scale is difficult and laborious, but is used more frequently. |
Question 10 Write the differences between a statement scale and a fractional scale.
Answer:
The differences between a statement scale and a fractional scale are as follows—
| Point of difference | Fractional scale | Graphical scale |
| 1. Concept | The relation between map distance and ground distance is shown as a fraction in this scale. | The map scale is represented graphically in this scale. |
| 2. Unit | This scale has no fixed unit. | This scale has a fixed unit. |
| 3. Uses | Values in any unit can be used in this scale, hence it is universal. | This scale is more widely used; however, it is difficult to convert from one unit to another. |
Question 11 write the differences between a statement scale and a fractional scale.
Answer:
The differences between a statement scale and a fractional scale are as follows-
| Point of difference | Statement scale | Fractional scale |
| 1. Concept | This scale is written in the form of a statement, for example. 1 cm to 5 km. | Fractional scale In this scale, the relation between map distance and ground distance is shown as a fraction, for example, R.F. 1: 50000. |
| 2. Unit | This scale has units. | This scale has no unit. |
| 3. Uses | It Is less useful. | It is more useful as compared to a statement scale. |
Chapter 9 Map Ans Scale Short Answer Type Questions
Question 1 What is meant by a map scale?
Answer:
Map Scale:-
A map scale is the ratio of the distance between two points on a map and their corresponding distance on the ground. Example—1 cm to 500 m.
Question 2 What is a fractional scale?
Answer:
Fractional Scale:-
The ratio of the distance between two points on a map and the distance between those points ore the ground is called fractional scale. For example, 1:3000 indicates that 1 unit on the map is equal to 3000 units on the Earth’s surface.
Question 3 On the basis of representation, how many types of scales are there and what are they?
Answer:
There are 3 types of scale—
1. Statement Scale,
2. Representative Fraction,
3. Graphical Scale.
Question 4 What is a statement scale?
Answer:
Statement Scale:-
On a statement scale, the scale of a map is written in the form of a sentence. For example, 1 cm to 2 km, where 1 cm on the map is equivalent to 2 km on the ground.
Question 5 Write two advantages of a statement scale.
Answer:
Two advantages of a statement scale are as follows—
1. It can be expressed easily.
2. Calculations can be avoided and graphical representation is not necessary as well.
Question 6 What will be the statement scale of a map if the fractional scale is 1:50000?
Answer:
The Statement Scale Of A Map If The Fractional Scale Is 1:50000 Is Shown Below:-
The fractional scale of a map is 1:50000. There is no fixed unit of this scale. Therefore, this scale can be converted to a statement scale easily, with the help of any specific unit. In this case numerator of the ratio is 1, which always represents the map distance and the denominator is 50000 which denotes the ground distance. This fractional scale can be changed to a statement scale in the following way—a distance of 1 cm on the map represents 50000 cm or 500 metres on the ground.
Question 7 Write two advantages of a fractional scale.
Answer:
Two advantages of a fractional scale are as follows—
1. This is a unitless scale, hence the scale can be changed easily.
2 . This scale can be easily converted to a statement scale or a linear scale.
Question 8 What is a graphical scale?
Answer:
Graphical Scale:-
When the relation of the map distance between two points and the actual distance between those two is shown with the help
of a graphical representation, it is known as a graphical scale.
Question 9 What is a linear scale? IB. What is a vernier scale?
Answer:
Linear Scale:-
In a vernier scale, a smaller scale is attached to the main scale, which is movable and can be used to obtain small fractional measurements accurately. It indicates the measurement that lies between two marks on the main scale.
Question 10 Write two advantages of a linear scale.
Answer:
Two advantages of a linear scale are as follows—
1. It is easy to understand since it is depicted as a straight line.
2. If the map is enlarged or reduced, the scale can also be changed accordingly with ease.
Question 11 What is a comparative scale?
Answer:
Comparative Scale:-
Measurements in two different units can be compared on a comparative scale. In this case, the primary and secondary parts have the same value, but they have different units. For example, 10 km and 10 miles.
Question 12 What is a diagonal scale?
Answer:
Diagonal Scale:-
A scale where two sets of lines cross each other obliquely, forming grids, which provides accurate- measurements for smaller units which cannot be obtained generally, is known as a diagonal scale.
Question 13 What is a vernier scale?
Answer:
Vernier Scale:-
In a vernier scale, a smaller scale is attached to the main scale, which is movable and can be used to obtain small fractional measurements accurately. It indicates the measurement that lies between two marks on the main scale.
Question 14 What is the importance of scale in a map?
Answer:
Importance Of Scale In A Map:-
A scale is of vital importance in the drawing of a map. A map is a two-dimensional representation of the world or any part of it, and this representation can be made accurately only with the use of a scale.
Question 15 Write two disadvantages of a fractional scale.
Answer:
Two disadvantages of a fractional scale are, as follows—
1. It is difficult for amateur readers to comprehend this scale.
2. If a map is reduced or enlarged, the scale has to be made afresh.
Question 16 What are primary and secondary divisions on a linear scale?
Answer:
Primary And Secondary Divisions On A Linear Scale:-
When a straight line of a particular length is divided into a specific number of parts, which are equal in length, each of those divisions is known as a primary division.- If these divisions are further divided into smaller parts, those are known as secondary divisions.
Chapter 9 Maps And Scale Multiple Choice Type Questions [Mcq Type]
Write the correct answer from the given alternatives
1. The scale that can be used in any country of the world is—
1. linear scale
2. fractional scale
3. 63000 inches
4. 63390 inches
Answer: 2. fractional scale
2. 1 mile is equal to—
1. 63000 inches
2. 63360 inches
3. 63390 inches
4. 63500 inches
Answer: 2. 63360 inches
3. The R.F. of a map is 1:10000 . To make the new R.F. of the map 1: 5000, it should be enlarged by— ’
1. 2 times
2. 3 times
3. 4 times
4. 5 times
Answer: 3. 4 times
4. The main advantage of a statement scale is that it is—
1. Easy To Understand
2. Small In Size
3. Can Be Shown On A Bigger Scale
4. None Of These
Answer: 1. Easy To Understand
5. diagonal scale is a type of—
1. Graphical Scale
2. Fractional Scale
3. Statement Scale
4. Linear Scale
Answer: 1. Graphical Scale
6. The ratio of the distance between two points on a map and the actual ground distance between those two points is called—
1. Statement Scale
2. Graphical Scale
3. Fractional Scale
4. Comparative Scale
Answer: 3. Fractional Scale
7. The inventor of the vernier scale is—
1. John Vernier
2. Lear Vernier
3. Pierre Vernier
4. None of them
Answer: 3. Pierre Vernier
8. 1 mile is equal to—
1. 1.6093 km
2. 1.9602 km
3. 0.1623 km
4. 1.3206 km
Answer: 2. 1.9602 km
9. 1 nautical mile is equal to—
1. 1.582 km
2. 1.285 km
3. 1.285 km
4. 1. 962 km
Answer: 1. 1.582 km
10. 2 cm to 2 km is a—
1. Statement Scale
2. Reflectional Scale
3. Graphical Scale
4. Vernier Scale
Answer: 1. Statement Scale
11. Numerator of R.F or fractional scale of the map is always—
1. 1
2. 10
3. 100
4. 1000
Answer: 1. 1
Chapter 9 Maps And Scale Fill in the blanks with suitable
1. The statement scale is Less of no use if a map is enlarged or reduced in size.
2. There is no unit in a fractional scale. Liner
3. The vernier constant is measured on a diagonal scale. inverse
4. The R.F. 1:50000 in a map means that 1 cm on the map is equal to 500 m on the actual ground surface Vernier
5.1 inches is equal to 2.54 cm. Unitless
6. The primary division of a linear scale always refers to the division’s summation of secondary divisions. primary
7. The ratio of scale increases when a map is enlarged. 16
8. The ratio of scale Tertiary increases when a map is reduced.
9. To draw a large-scale map, scale is used mostly linear
10. The great advantage of the R.F. scale is its proportional universal use because it is a scale.
Chapter 9 Maps And Scale If The Statement Is True, Write True And False If Write False Against The Following
1. The statement scale is of no use if a map is enlarged or reduced in size. True
2. There is no unit in a fractional scale. True
3. The vernier constant is measured on a diagonal scale. False
4. The R.F. 1:50000 in a map means that 1 cm on the map is equal to 500 m on the actual ground surface. True
5.1 inches is equal to 2.54 cm. True
6. The primary division of a linear scale always refers to the summation of secondary divisions. True
7. The ratio of scale increases when a map is enlarged. False
8. The ratio of scale increases when a map is reduced. True
Chapter 9 Map And Scale Match The Left Column With The Right Column
| Left colum | Right column |
| 1. 1 mile | A. 1.852 km |
| 2. 1 nautical mile | B. 0.6214 km |
| 3. 1km | C. 1.6093 km |
| 4. 1 foot | D.12 inches |
Answer: 1-C,2-A,3-B,4-D
Chapter 9 Map And Scale Answer In One Or Two Words
Question 1 What is the ratio of the distance between two points on a map and those two points on the ground known as?
Answer: Map scale.
Question 2 Name an instrument where the vernier Barometer is.
Answer: scale is seen.
Question 3 What is the other name of the diagonal scale?
Answer: Gunter’s scale
Question 4 Which scale is used to compare two units?
Answer: Comparative scale.
Question 5 What do the figures on the left side of a fractional scale indicate?
Answer: Map distance.
Question 6 What do the figures on the right side of a fractional scale indicate?
Answer: Ground distance.
Question 7 Which scale is represented graphically?
Answer: Graphical scale.
Question 8 How many types of graphical scales are there?
Answer: 4 types.
Question 9 What type of scale is a vernier scale?
Answer: Graphical scale.
Question 10 1 inch is equal to how many cm?
Answer: 2.54 cm.
Question 11 When a map is reduced in size, how does its scale change?
Answer: It is enlarged.
Question 12 How many types of maps are there, based on the scale?
Answer: Three types.
Question 13 1 km is equal to how many miles?
Answer: 0.6214 miles.
Question 14 What is the other name for fractional scale?
Answer: Representative fraction.