
WBBSE Solutions For Class 9 Maths Statistics Chapter 2 Histogram And Frequency Polygon
Chapter 2 Histogram And Frequency Polygon Histogram:
We get some rectangles when the class intervals of any continuous grouped frequency distribution are plotted along the X-axis and the corresponding class-frequencies are plotted along the Y-axis of a graph- paper, the breadths of which are the class lengths and the lengths are the class-frequencies when they are equal or are proportionate to the frequency densities of the corresponding class-intervals when they are unequal.
We know, the area of a rectangle = Length x Breadth
= Frequency density x class-length
= \(\frac{\text { class }- \text { frequency }}{\text { class }- \text { length }} \times \text { class }- \text { length }\)
= class-frequency.
Read and Learn More WBBSE Solutions For Class 9 Maths
∴ When the class lengths are unequal, the areas of the rectangles are proportionate to the corresponding class frequencies.
Therefore, The graphical representation of the grouped frequency distribution of any continuous variable by some adjacent rectangles is known as Histogram.
If the class lengths be not all equal, then the areas of the rectangles are not proportionate to the class- frequencies. In this cases, while histograms are constructed-
The last class length is assumed as one unit.
The lengths of the other rectangles are taken as a proportion of this unit.
For example, if the frequencies of the class intervals 0 – 10, 10 – 30, 30 – 50, 50 – 80, 80 – 100, ………etc. be respectively 4, 16, 12, 18, 8,……………….. etc., then the lengths of the rectangles will be
\(\frac{4}{10} \times 10=4, \quad \frac{16}{20} \times 10=8, \frac{12}{20} \times 10=6, \frac{18}{30} \times 10=6, \frac{8}{20} \times 10=4\)……………………etc. respectively.
Then the areas of the rectangles will be proportionate to the corresponding class frequencies.

Chapter 2 Histogram And Frequency Polygon Method Of Construction Of Histograms
A working rule of construction of histograms of any given continuous grouped frequency distribution:
STEP-1: Plot the class boundaries of the class intervals along the X-axis of a graph paper consecutively.
If the class boundaries do not start from O, the class boundaries should
be plotted from a point that is at a short distance from the origin on the right side and the part between the starting point and the origin should be marked by a curved line like
![]()
STEP-2: The class frequencies of each class interval (or it’s proportionate) should be then plotted along the Y-axis.
In this case, follow the rule discussed above for equal or unequal class- lengths.
STEP-3: Construct a rectangle for each of the cases thus plotted taking class lengths as breadth and class frequencies as length.
Since the values of the variable are continuous, there will be no gap between the two consecutive rectangles.
Thus, the total pictorial of the continuous rectangles as a whole will be the required histogram.
Chapter 2 Histogram And Frequency Polygon
Frequency Polygon:-
Like a histogram, the frequency polygon is also a graphical representation of a given data and its frequencies.
In a frequency polygon (grouped or ungrouped), the values of the variables are plotted along the X-axis, and the corresponding frequencies are plotted along the Y-axis accordingly, a polygon is constructed, which is the pictorial representation of the given frequency distribution.
Therefore, the graphical representation of a frequency distribution (grouped or ungrouped) by a polygon is called a frequency polygon.
Three methods of construction of frequency polygons are discussed below:
- Construction of frequency polygon of ungrouped data;
- Construction of frequency polygon of grouped data and its frequencies.
1. Frequency Polygon of ungrouped data:
To construct a frequency polygon of any ungrouped data and its frequencies, the values of the variables are taken as the x-coordinates and the corresponding frequencies as the y-coordinates to plot the points thus obtained.
Observe the following example:
Example: The marks obtained by 15 students in a Math exam in the Desbandhu Chittaranjan College are given below:
21, 20, 20, 19, 21, 19, 19, 22, 20, 20, 22, 21, 20, 21, 22.
Construct a frequency polygon of the above data.
Solution:
Arranging the given data we get the following frequency distribution table:
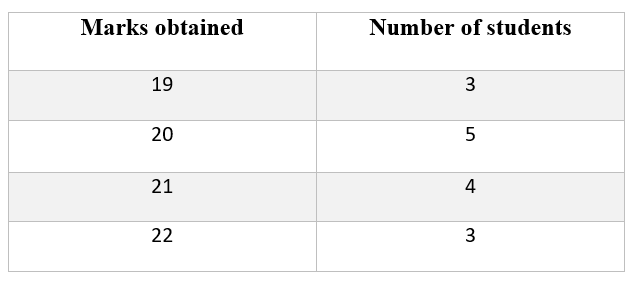
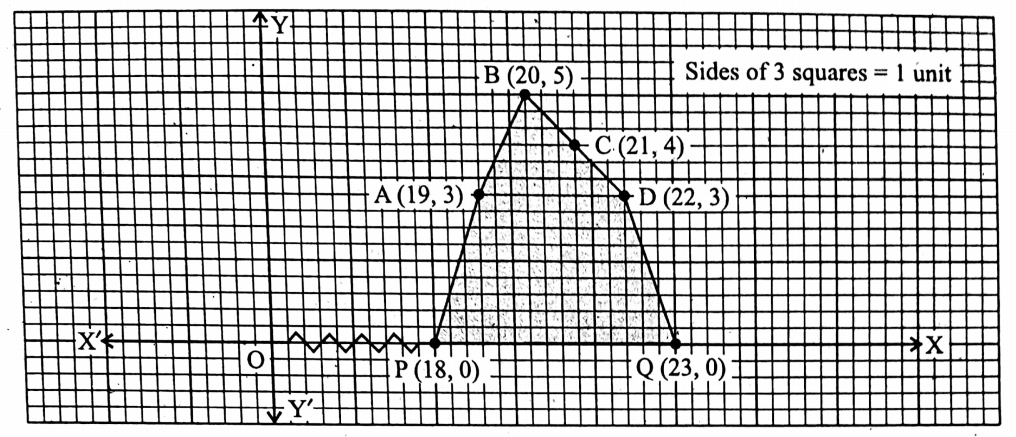
Now, the points (18, 0), (19, 3), (20, 5), (21, 4), (22, 3), and (23, 0) are plotted in white or graph paper.
Let the points be P, A, B, C, D, Q.
Then the polygon PABCDQ is the required frequency polygon.
2. Frequency Polygon of grouped data :
We can construct a frequency polygon of a given continuous grouped frequency distribution in two methods:
- At first, constructing a histogram and then constructing a frequency polygon from it.
- Constructing a frequency polygon directly, i.e., without constructing any histogram.
1. Construction of frequency polygon after constructing histogram :
In this method, at first, a histogram of the given continuous grouped frequency distribution is constructed according to the above-mentioned method.
Then, the class mark of the previous class interval of the first class interval and the class mark of the interval next to the last class interval are determined.
The polygon obtained by joining the mid-points of the breadths of the rectangles in the histogram constructed firstly to the points thus determined is our required frequency polygon.
2. Construction of frequency polygon directly, i.e., without the construction of histogram :
In this method, at first, all the class marks of the class intervals are determined.
Then plotting them along the X-axis and their corresponding frequencies along the Y-axis, some points are plotted. Later on, the polygon obtained by joining those points by straight lines is our required frequency polygon.
Question 1. Daily profits (in Rupees) of 50 shops in the village Bakultala are given below:
Given
Daily profits (in Rupees) of 50 shops in the village Bakultala are given below:
Daily profits (in Rupees).

Construct a histogram of the above data.
Solution:
Here, all the given class intervals are continuous.
Now, let us take X’OX as X-axis and YOY’ as Y-axis.
Selection of Scale:
Along the X-axis the length of the sides of each smallest square = 10 units and along the Y-axis it is I unit.
Now, let us plot the class intervals along X-axis.
Then, let us construct the rectangles for each of the class intervals taking class lengths as the breadths and the corresponding frequencies as the lengths (heights) of the rectangles.
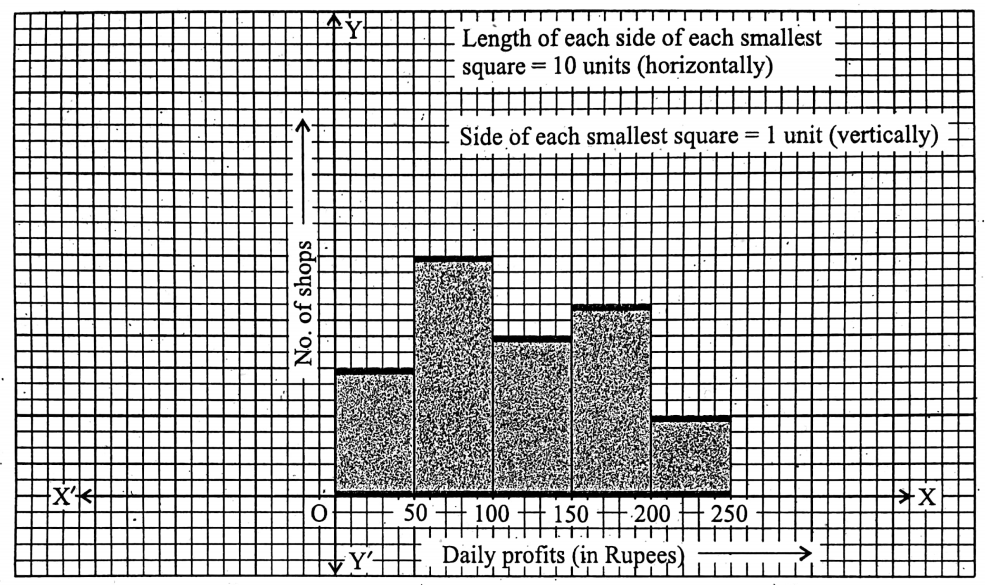
Then the pictorial presentation of the rectangles as a whole is the required histogram.
Question 2. Construct a frequency polygon of the following frequency distribution after constructing a histogram of the same :

Solution:
Expressing the given data into a grouped frequency distribution we get the following table:
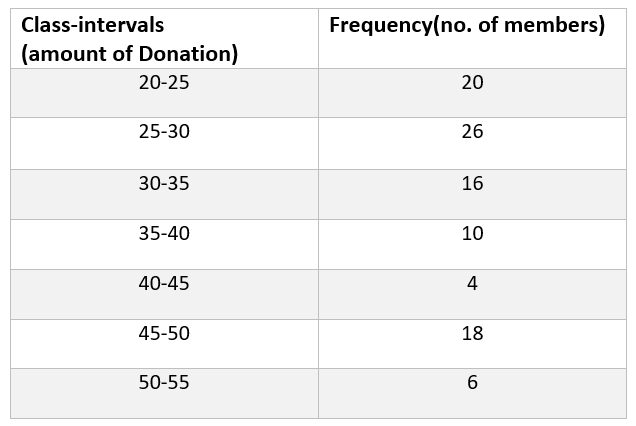
Now, according to the figure, let us plot the class intervals 20- 25, 25- 30, 30-35, 35-40, 40-45, 45- 50, and 50- 55 along X-axis.
The frequency of the first class interval is 20.
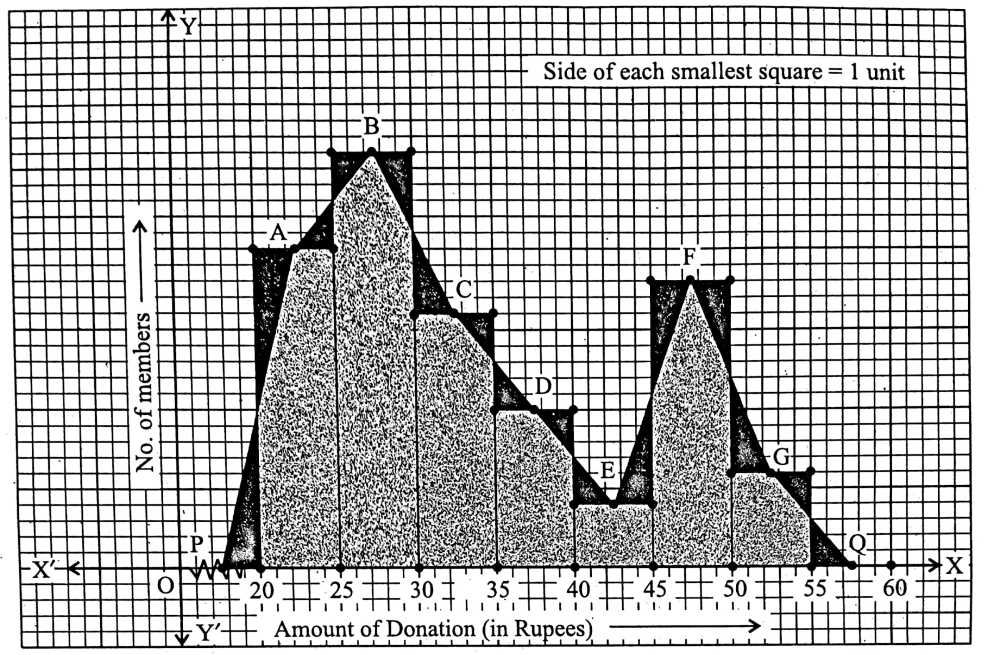
∴ taking the class-length 5 as the breadth (∵ 20-25 interval has the class-length 25 – 20 = 5) and the corresponding frequency 20 as the length (height), let us construct the first rectangle for the first class interval.
Similarly, all the rectangles for all the class intervals with the same breadth 5 and corresponding frequencies as the lengths (heights) are constructed.
Then the pictorial figure thus obtained by the adjacent rectangles as a whole is our required histogram.
Construction of frequency polygon :
To construct a frequency polygon let us determine the class mark of the previous class interval of the interval (20-25).
Here, class-mark = \(\frac{15+20}{2}\)
Assuming 0 as its frequency, this class mark is plotted along the X-axis. Let the mid-point be P.
Now, taking the mid-value of the first interval (here, mid-value = \(\frac{20+25}{2}\) = 22.5) 22.5 as the x-coordinate and the corresponding frequency as the y-coordinate, let us plot a point.
Let the point be A.
According to the same procedure, let us plot the points B (27.5, 26), C (32.5, 16), D (37.5, 10), E (42.5, 4), F (47.5, 18), G (52.5, 6).
At last, taking the mid-value of the next class-interval, i.e., (50- 60) of the last class-interval (50-55) (here, mid-value = \(\frac{55+60}{2}\) = 57.5) as the x-coordinate and 0 (as its frequency) as the y-coordinate the last point (57.5, 0) is plotted.
Let the point be Q.
Now, joining the points P, A; A, B; B, C; C, D ; D, E; E, F; F, G and G, Q by straight lines we get a polygon PABCDEFGQP, which is the required frequency polygon.
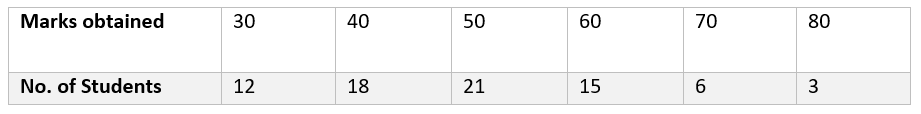
Question 3. Construct an independent frequency polygon of the following marks obtained by 75 students of the school of Prithas
Solution:
Let us take X’OX as the x-axis and YOY’ as the Y-axis in the graph paper.
O is the origin.
Also taking along the X-axis, side of each smallest square = 5 units and along the Y-axis, side of each smallest square 1 unit, we get the reduced coordinates
(6, 12), (8, 18), (10, 21), (12, 15), (14, 6), and (16, 3) of the coordinates (30, 12), (40, 18), (50, 21), (60, 15), (70, 6), and (80, 3).
Now, the marks obtained just before 30 will be 20, and just next to 80 will be 90.
∴ According to the scale, the reduced coordinates of (20, 0) (∵ frequency of 20 is assumed to be 0) and (90, 0) will be (4, 0) and (18, 0) respectively.
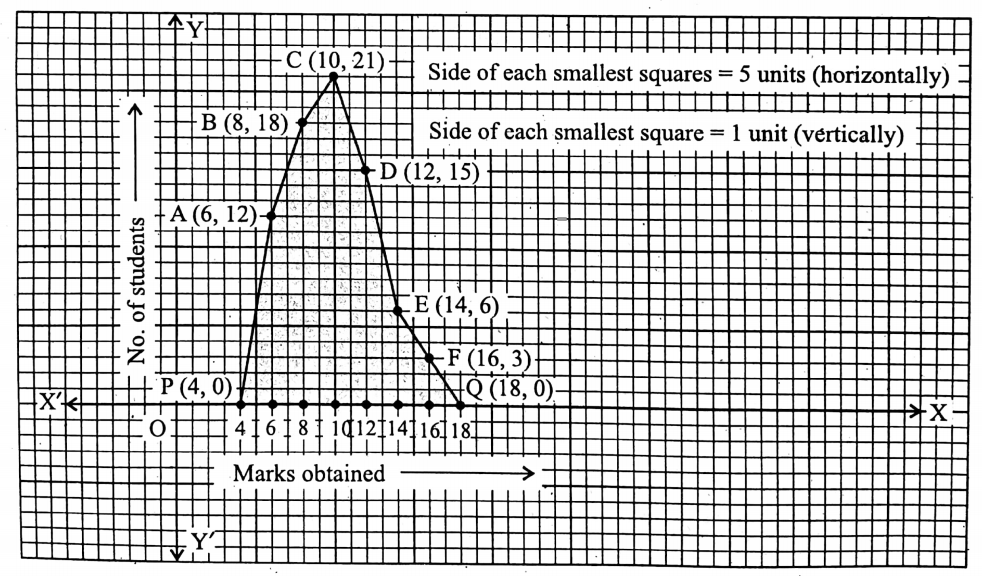
Thus plotting in the graph paper the points (4, 0), (6, 12), (8, 18), (10, 21), (12, 15), (14, 6), (16, 3) and (18, 0) let us they are respectively P, A, B, C, D, E, F and Q.
Let us join the points P. A; A, B; B, C; C, D; D, E; E, F and F, Q by straight lines.
Thus a polygon PABCDEFQP is produced.
∴ PABCDEFQP is the required frequency polygon.
Question 4. Construct an independent frequency polygon of the following frequency distribution : (Give scale and construction signs. Description is not necessary.)
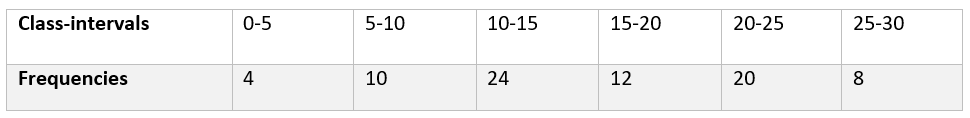
Solution :
Selection of Scale: Along the X-axis and Y-axis, the side of each smallest square= 1 unit.
Mid-values of the class intervals are respectively
\(\frac{0+5}{2}=2 \cdot 5, \frac{5+10}{2}=7 \cdot 5, \frac{10+15}{2}=12 \cdot 5, \frac{15+20}{2}=17 \cdot 5, \frac{20+25}{2}=22 \cdot 5 \text { and } \frac{25+30}{2}=27 \cdot 5\)
∴ the points to be plotted are P (-2.5, 0), A (2·5, 4), B (7.5, 10), C (12.5, 24), D (17.5, 12), E (22.5, 20), F (27.5, 8) and Q (32.5, 0).
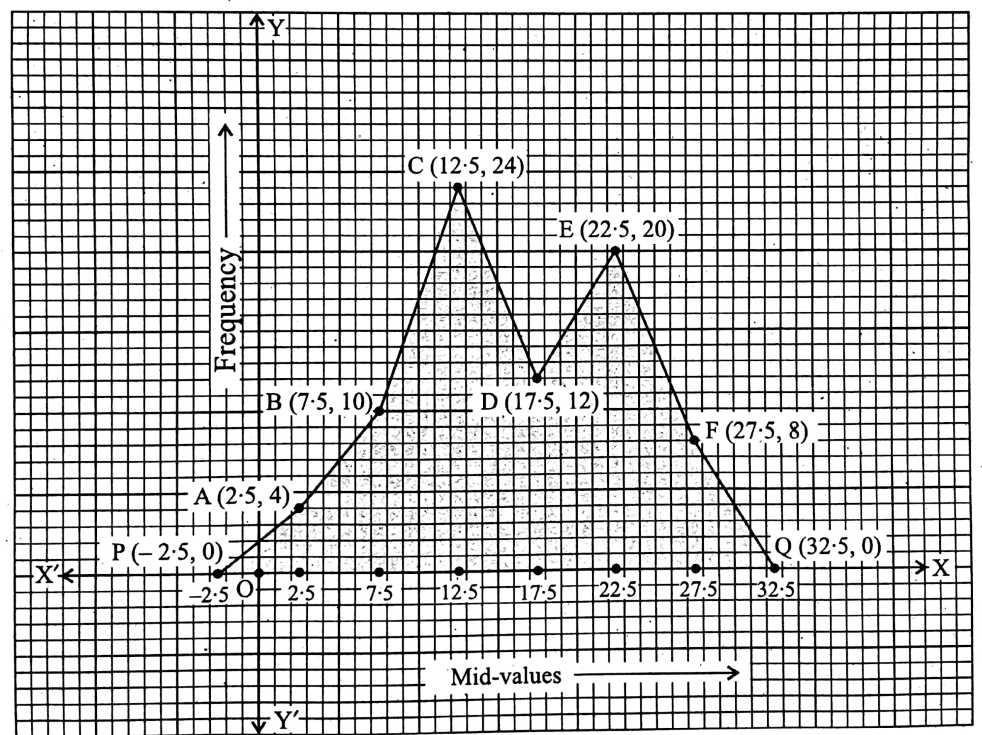
∴ PABCDEFQP is the required frequency polygon.